SPCX Day One: $160.95 and the
Short Book Nobody Was Ready For
SPCX opened at $150, touched $176.52, and closed at $160.95. The short positions established near $135 are under water. The short positions entered near the high are already in profit. The mindsets behind those two positions are not the same, and the stock loan market will feel both of them differently across the next 180 days.
SPCX priced at $135 on June 11, raising $75 billion through the sale of roughly 555.6 million shares, the largest IPO in history by proceeds, surpassing Saudi Aramco's $29 billion debut in 2019. It opened on the Nasdaq at $150 on June 12, traded as high as $176.52, and closed at $160.95, up 19.2 percent from the offer price. The close implies a market capitalization of roughly $2.11 trillion, placing SpaceX among the world's most valuable public companies, roughly sixth among U.S. public companies at the close. Day-one volume was 519.2 million shares.
The book was four times oversubscribed at the fixed $135 offer price. SpaceX bypassed the traditional pricing range process and set $135 as a take-it-or-leave-it figure well before the abbreviated roadshow. That decision made the first-day pop structurally predictable. The question that opens tonight is what the close at $160.95 means for the short positions established at various points across today's range, and what those positions mean for the stock loan market over the next 180 days.
What the Market Said Today
The sell-side framing on day one was nearly unanimous on narrative and sharply divided on valuation. Wedbush analyst Dan Ives set the prevailing bull frame in a note distributed before the open.
"SpaceX going public is an important moment for the broader tech sector in our view as this AI Revolution and data takes this next step forward."Dan Ives, Wedbush Securities • June 12, 2026
That framing, AI revolution infrastructure rather than rocket company, is the narrative that drove the first-day pop and the intraday spike to $176.52. It positions SPCX against Nvidia and Microsoft rather than against Boeing and Lockheed Martin. At a $2.11 trillion market cap, the aerospace comparable set produces a short thesis with immediate mathematical credibility. The AI infrastructure comparable set does not, and that asymmetry is the tactical reality every short position is managing against from tonight's close.
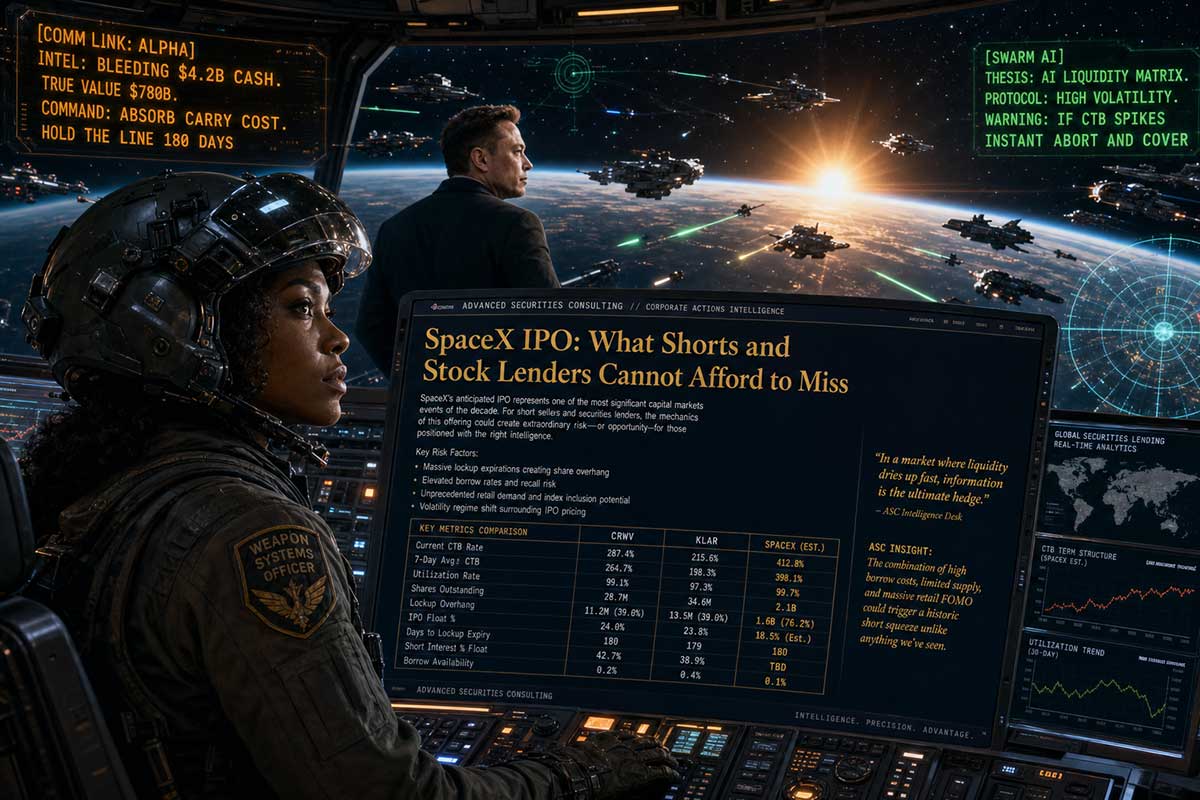
The bears were equally direct. Morningstar placed fair value near $780 billion, a roughly 63 percent discount to today's close, implying the market is paying a 170 percent premium over Morningstar's assessed value. CFRA senior equity analyst Keith Snyder described the incoming class of mega-IPOs as companies that are "as far from stable as you can get," adding that they are "bleeding cash at ridiculous rates." SpaceX reported $18.7 billion in 2025 revenue, a net loss of $4.9 billion, and an operating loss of roughly $2.6 billion. At today's close, SPCX trades at approximately 113 times 2025 revenue. Among the public companies already valued above $1 trillion, SPCX's revenue sits well below the lower revenue edge of that peer group.
"It's not like investors are home doing math."IPO market observer, quoted in CNBC • June 9, 2026
Renaissance Capital's data provides the scale marker for the full 2026 IPO market. Renaissance's own proceeds table shows $29.6 billion raised in U.S. IPOs in 2024 and $44.0 billion in 2025, totaling $73.6 billion across those two full years. SpaceX's $75 billion single-deal raise exceeds that two-year total. Renaissance strategist Matt Kennedy has characterized the recovery as "top-heavy," concentrated among a small group of marquee names rather than broadly distributed. Capital rotating into SPCX at this scale pulls institutional risk budget away from existing positions. Tesla borrow desks had reason to watch SPCX order flow as a correlated indicator throughout today's session.
Two Short Populations, Two Completely Different Problems
Short Positions Near $135: The Fundamental Case and Its Current P&L
The fundamental short thesis for SPCX was fully formed before the IPO priced. Morningstar placed fair value near $780 billion, implying a roughly 63 percent discount to today's close. SpaceX reported $18.7 billion in 2025 revenue, a net loss of $4.9 billion, and an operating loss of roughly $2.6 billion. The dual-class structure grants Musk more than 80 percent of the voting power, leaving public shareholders with no meaningful governance rights. These are the structural characteristics that precede significant valuation resets in large-cap growth names over a multi-year horizon.
Short positions established with economic exposure near the $135 IPO price, through IPO allocation hedges, grey-market contracts, or derivatives executed before the open, are carrying approximately a 19.2 percent mark-to-market loss at today's close of $160.95, before borrow cost. At 20 percent annualized borrow cost on a 180-day hold, carry adds approximately 9.9 percent to total position cost. Break-even is approximately $121.68, a 24.4 percent decline from today's close. The thesis is intact. The execution window has extended under adverse conditions from day one.
Economic entry near $135. Close $160.95. Mark-to-market loss: 19.2 percent before borrow. At 20 percent annualized borrow for 180 days, carry adds approximately 9.9 percent. Combined position cost at expiry break-even: approximately 29 percent below current close on a full-duration hold with no further stock movement. Break-even cover price: approximately $121.68, a 24.4 percent decline from tonight's close. A sustained correction is required. The timeline for delivering it runs through the December lockup.
Short Positions Near the High: Already in Profit, Different Thesis Entirely
The short position established near the $176.52 intraday high is in profit tonight. The stock fell 8.8 percent from the high to the close of $160.95. That profit is real and it is already eroding via borrow cost, but the mark-to-market position at tonight's close is positive, not negative. This short did not enter on the fundamental thesis. It entered on the observation that a 30 percent intraday spike from a fixed IPO price typically does not hold, and that the mean reversion from $176 toward the $150 opening range was the high-probability trade on day one. That observation was correct.
The high-entry short is a duration trade measured in days to weeks, not months. If SPCX continues to retreat toward the $140 to $150 range in the next two to three sessions, this position delivers. If the stock holds above $165 under ETF mechanical buying pressure for 30 days, combined borrow cost and loss of the mark-to-market cushion forces a cover regardless of directional conviction. The tactical short does not stay the course through a recall. It covers, and that covering itself becomes a buying bid that supports the stock near the levels the fundamental short needs to see break.
The Mindset Divide: What It Means for Borrow Market Dynamics
These two short populations have directly opposing responses to the same borrow market events. A CTB spike is a carry cost problem for the 180-day fundamental short, who absorbs it as part of the thesis cost. The same CTB spike is an immediate exit signal for the tactical short, for whom borrow cost above a threshold makes the trade uneconomical regardless of conviction. As CTB rises, tactical shorts cover first, borrow demand drops, and the resulting CTB decline becomes an observable signal about the state of the consensus book. That oscillation is visible in loan age distribution data, which is one reason average loan age is the analytical focus of our next PoC trial.
| Attribute | Fundamental Short (~$135 Entry) | Tactical Short (~$176 Entry) |
|---|---|---|
| Economic entry | ~$135 (IPO-linked) | $150-$176.52 intraday |
| Mark-to-market at close | -19.2% unrealized | +8.8% (stock fell from high) |
| Thesis basis | Valuation vs. earnings reality | Intraday mean reversion |
| Duration horizon | 180+ days / December lockup | Days to weeks |
| CTB elasticity | Low / absorbs carry cost | High / exits above threshold |
| Recall response | Rolls borrow / manages recall | Covers on first recall notice |
| Lockup relevance | Central to the thesis | Incidental / not the trade |
| Signal to lenders | Stable demand / relationship value | Volatile demand / spot price taker |
What Today Means for Stock Lenders
Today was a strong opening for lenders with SPCX inventory. A 19.2 percent first-day pop generated borrow demand from both short populations, and day-one volume of 519.2 million shares confirms active two-sided trading from the first hour. CTB rates in high-demand low-float IPO names typically establish an early floor that persists for several weeks until cornerstone sellers begin releasing inventory into the market.
Three lending windows run across the lifecycle. Window one runs from today through end of underwriter stabilization, when supply comes almost entirely from the IPO float and whatever cornerstones not subject to lockup choose to lend. Rates in this window are set by the intersection of that constrained supply and the short interest building from both populations. Lenders with early accurate intelligence on demand-side positioning are best placed to price offensively from the start rather than chasing rates as utilization rises.
Window two runs from end of stabilization through the primary lockup expiry in December. This is where CoreWeave's most dramatic lending revenue events occurred. Short interest builds, utilization rises, and rates follow. Lenders who hold inventory through this window and monitor the signal set continuously capture the full rate trajectory.
Window three is the lockup expiry mechanics. As Klarna demonstrated, the calendar date is less important than the conversion mechanics. For SpaceX, the xAI merger adds a second class of locked holders with different cost bases, holding periods, and potentially different lockup terms. Any mechanics delay analogous to the Computershare letter-of-transmittal issue in KLAR will produce a supply shortage on expiry day that consensus rates will not reflect. That is not a tail scenario for this name. It is the base case for close monitoring.
Establish locate inventory no later than T-5 from any confirmed secondary supply event. Monitor the EDGAR calendar for Form 144 filings from pre-IPO shareholders in the 30 days before the December lockup expiry. Treat silence in the Form 144 pattern as a potential signal of structural constraint on expiry-day supply. Do not price for general collateral rates in the week before lockup until EDGAR silence is ruled out. The KLAR case showed what that assumption costs when the mechanics fail. SPCX carries more structural complexity, not less.
Buy-In Risk, Staying the Course, and the Recall Calendar
The buy-in question is live as of tonight's close. Any short position established near $135 is carrying a significant mark-to-market loss. Prime brokers are watching those positions now. Recall risk builds as utilization rises, and the day-one dynamics of SPCX, with a 3 percent float and immediate institutional short interest from both populations, suggest utilization will increase steadily in the early weeks.
For the fundamental short established near $135, the response to a potential recall is a logistics problem, not a thesis invalidation. The desk that has pre-arranged borrow through a stock lending relationship with inventory visibility is positioned to roll to another lending source rather than covering at a loss. That preparedness separates the well-run fundamental short from the one that gets squeezed out of a correct thesis by a mechanics failure. The KLAR case is the reference. Desks that had pre-arranged relationships held their positions through the recall pressure on lockup day. Spot-locate desks covered into the spike.
For the tactical short at $176, the recall calculation is different. A short-duration position running borrow cost against a cushion of 8.8 percent mark-to-market gain has a narrow window of safety. If SPCX continues to decline, the trade builds. If it reverses back toward $170 on ETF demand flows in the next two to three sessions, the borrow cost and receding mark-to-market gain combine to force a cover. That forced covering is itself a bid that supports the stock at precisely the levels the fundamental short needs to see weaken. The two populations are structurally at cross-purposes, and both lenders and venues should track which one is driving borrow demand on any given day.
The two short populations create a natural CTB oscillation as the tactical population enters and exits in response to rate levels. Lenders who identify which population is driving demand on any given day can price inventory more accurately than lenders treating the book as a uniform signal. Average loan age is the primary discriminator in our next PoC trial. The put-call ratio in SPCX options, which open June 16, is the second instrument. Form 144 filing patterns in the 30 days before December lockup expiry are the third. These three signals, read together, are what allowed our models to flag the KLAR supply shortage four days before the market priced it.
Nine Event Windows: IPO to Final Lockup
SPCX is not a single event. It is a sequence of nine discrete windows, each with its own supply-demand dynamics, each producing signal events in the lending book before they show up in rates. The desk that maps all nine in advance and monitors each one continuously will capture the rate events along the way. The desk that revisits at lockup only will be behind the market at every one of them.
The fundamental short thesis remains intact through all nine windows. Morningstar's $780 billion fair value estimate implies a 63 percent correction from tonight's close. That correction does not arrive in a straight line. It arrives in the windows between mechanical demand events, after narrative momentum exhausts itself, and most forcefully at the lockup expiry windows where locked supply becomes available. The desks that are monitoring all nine windows continuously from tonight are the ones that will be positioned for each rate event as it develops.