

As of September 2024, LUCY stock is exhibiting heightened market attention due to significant price swings, trading volume, and utilization metrics. A closer look at these key data points and trends offers valuable insights for investors.
Price Dynamics and Trading Volume
LUCY’s price has been oscillating across a broad range, with notable trading activity clustered at specific levels. The -1000 to -995 USD band witnessed a substantial volume of 22,600 units, suggesting a potential support or resistance zone. Other high-volume ranges include -925 to -920 USD (21,000 units) and -800 to -795 USD (21,600 units), further highlighting investor interest at these points.

Goldilocks Rate (GLR) and Market Sentiment
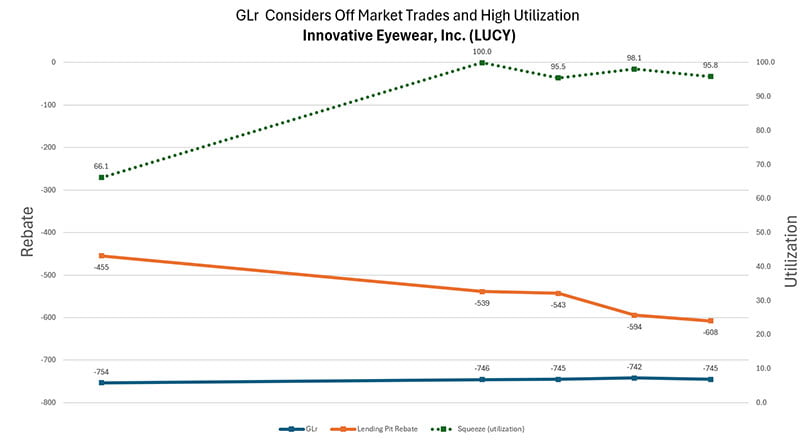
The “Goldilocks rate” (GLR) is the midpoint rate for a security loan, which is advantageous for both the lender and borrower because it is not so low that it discourages borrowers from providing cash collateral nor so high that it compels lenders to recall and reallocate their shares to borrowers willing to accept lower rebates. The GLR, a key indicator of LUCY’s borrowing and lending activities, has shown consistent negative movement in early September. This suggests pressure in the lending market, potentially driven by high borrowing demand or short-selling interest. Such negative rates can contribute to market volatility and warrant careful monitoring.

Or alternatively, kurtosis is a valuable tool for understanding the risk of extreme price movements. For LUCY, a leptokurtic skew that we can see on the right-hand side would suggest a mispricing that will significantly affect the weighted average. The higher instance of outlier movements must be considered to reap sharp gains or avoid losses.

Squeeze Potential and Utilization
LUCY’s squeeze utilization percentage has remained consistently elevated, exceeding 90% on several occasions. This implies a high likelihood of a short squeeze as most available shares are lent out. This situation could attract traders seeking to capitalize on potential volatility arising from these lending constraints.
Investor Implications
LUCY’s combination of high trading volume at specific price levels and consistently high utilization rates suggests potential for significant price fluctuations in the near future. Investors should closely track the stock’s support levels, GLR movements, and utilization rates for signs of short-selling pressure. These insights can inform strategic decision-making in navigating the evolving market dynamics.
Conclusion
This analysis offers a snapshot of LUCY’s current market performance and factors contributing to its volatility. High trading volumes at key price levels, coupled with consistently elevated utilization rates and negative GLR movements, paint a picture of a dynamic market landscape. Investors are advised to closely monitor these trends and consider the potential for short-selling pressures and price swings when making investment decisions regarding LUCY.